It would be great to have a code that generates alerts when price hits certain fibonacci retracement levels... I'm not capable of doing it yet, but Do you think this can be done? More like a fibonacci version of Tradable Trend. User can identify the peak and bottom and code can generate alert if price hits fibonacci levels...Do you think that works?
thank you
Size:
Color:
QUOTE:
Do you think that works?
It depends on what you mean. For trading, I suspect that fibonacci levels will work as good as any other arbitrary levels that you draw.
Here's some code to play with. It finds the last trough based on the specified % reracement and then calculates the fibonacci retracments from the highest high since that trough. Alerts are created to buy at the retracement levels if the most recent Close is higher than those levels.
CODE:
Please log in to see this code.
Size:
Color:
Thank you Cone.
"Do you think that works?" was meant to ask if it's technically possible to generate such a code that works effectively.
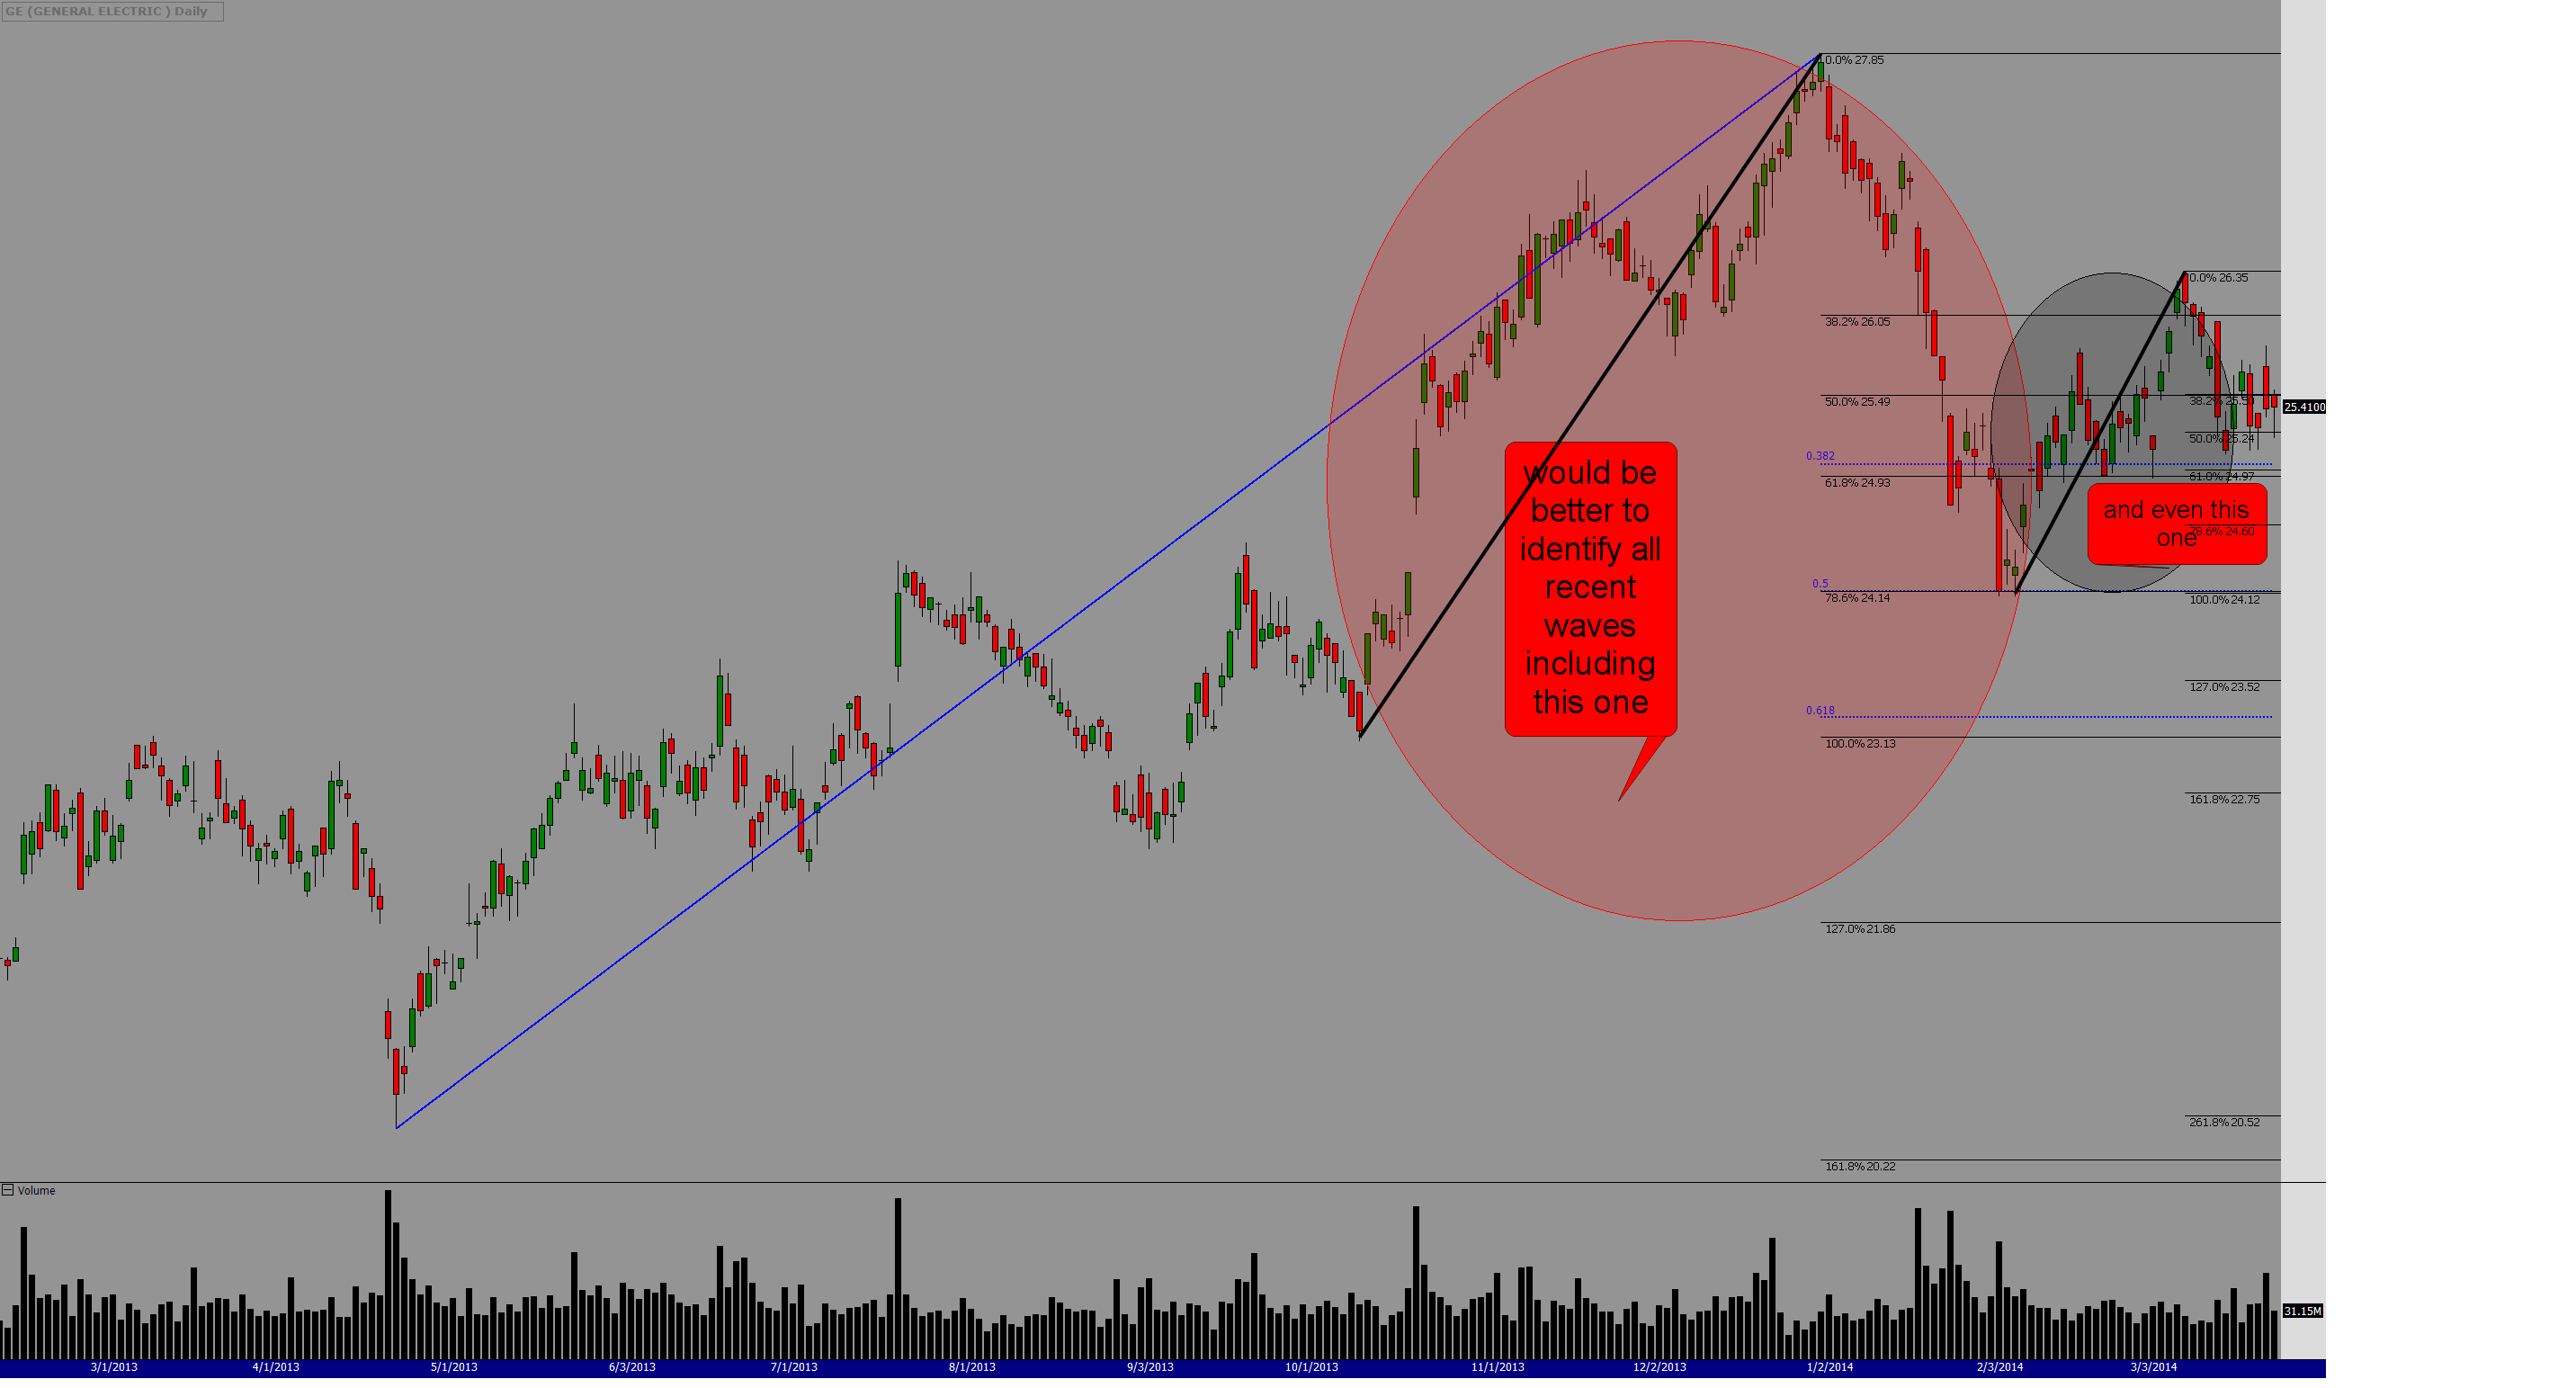
This one looks good but i'd need some minor changes if you dont mind. What could be done to take shorter term waves into account as well?
It can show me all recent waves and retracements and i can chose whichever i want to use to trade... Please take a look at the attached chart, ..And also could you please make a slight amendment on the way it generates signals i.e. Alert only if the relevant closing price is 1% around the fibonacci levels you have in the code.
Thanks a lot
Size:
Color:
Sorry ignore the previous chart attached. This one is the correct one
Thanks
Size:
Color:
I just asked if you guys can help me regading above request?
Thanks
Size:
Color:
The problem with requests like these is that they tend to result in code that is never exactly what you want, which leads to revision after revision due to lack of fixed requirements; and for this there is no time. Sure I could make it look for those waves on that chart, but you'll pull up another chart and it won't find the correct waves for that chart. I could even make it find "all waves" in the entire chart, but then you'll have so many lines on the chart the result will be irrelevant.
The algorithm in the script that I supplied is very clear. It finds the wave from the last trough of the specified percentage (which you can change with the slider) to the highest point from the trough. Come up with your algorithm, make sure it's the right one, and we'll take a shot at it as time permits.
Size:
Color:
Interesting script. Buys, but does not sell. Necessary to close a position manually?
Size:
Color: