I am attempting to code a couple of P & F based strategies and I have a couple of questions. Is there anyway to initialize the TPnF class so that it uses the automated settings available from the chart settings dialog? I am also having problems reconciling the signals obtained from DblTopDblBottom with the P & F charts. I can see double bottoms/tops on the charts which are not being detected on the +- 2 return from this function.
Size:
Color:
QUOTE:
Is there anyway to initialize the TPnF class so that it uses the automated settings available from the chart settings dialog?
You can access the
uxPnFChartStyle.* properties from the WealthLabConfig.txt in the Data folder, but it's only updated for certain events; shutdown is one of them.
QUOTE:
I can see double bottoms/tops on the charts which are not being detected on the +- 2 return from this function.
If you can be more specific about the data, symbol, PnF settings, and dates, I'll take a look.
Size:
Color:
I don't seem to have that config file in my data folder. Using the Point and Figure Basic script rather than my test script and looking at AMDT I see a buy signal in the X column dated 10/07/2007 (I'm from the UK so that is a British date!) and the corresponding sell signal is at 30/09/2008 whilst the chart shows at least 3 sell signals between these dates. According to the chart it is using a 0.5 box size with a 3 reversal.
Size:
Color:
On which exchange is AMDT trading? Company name?
On you're way back with that answer, check to make sure that the both PnF chart style settings and the PnF object are both using the Log method, or conversely, not using the arithmetic (not Log) method.
Size:
Color:
Thanks, you have solved that for me. My P&F chart settings didn't agree with the settings passed to the PnF object. I had assumed that the script settings overrode the chart settings. Anyway my signals are now correct so I am happy. I may have more questions later since I exploring whether it is possible to script detection of the classic buy and sell formations.
Size:
Color:
That's good news.
Since you're from the UK and probably reading du Plessis, here's a link to a script that you'll probably want to have:
Bullish Percent Index, BPI.
Size:
Color:
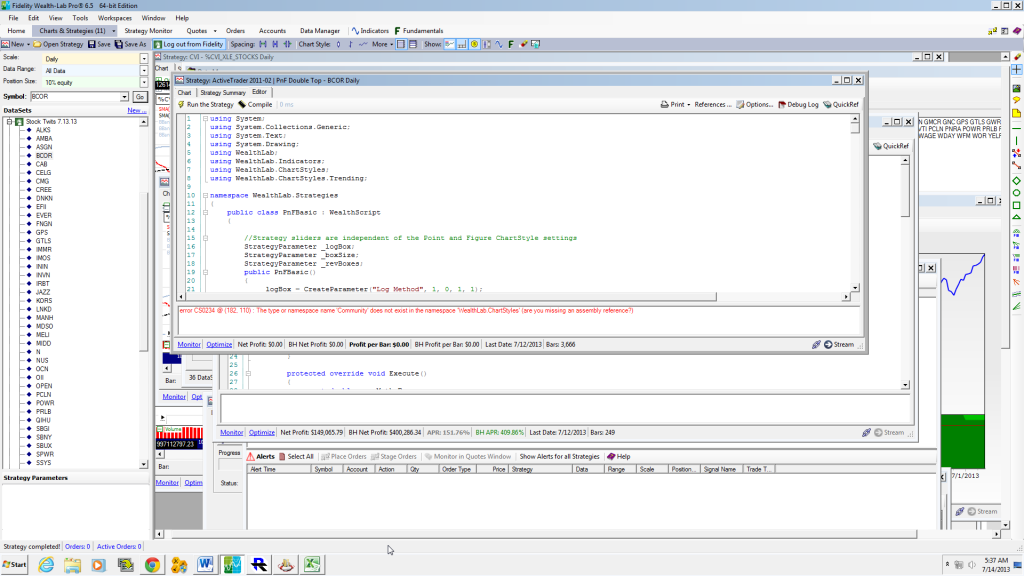
The basic version works fine but the full strategy gives an error msg asking if I'm missing an "assembly reference"?
Size:
Color:
Disregard last...I figured it out. Eliminated the offending code.
Size:
Color:
Size:
Color: